Shadow Graphs: Visualizing Community Sentiment Shifts Across Platform-Specific Forums for Shared Game Series
Yves Wolf · Jul 24, 2026
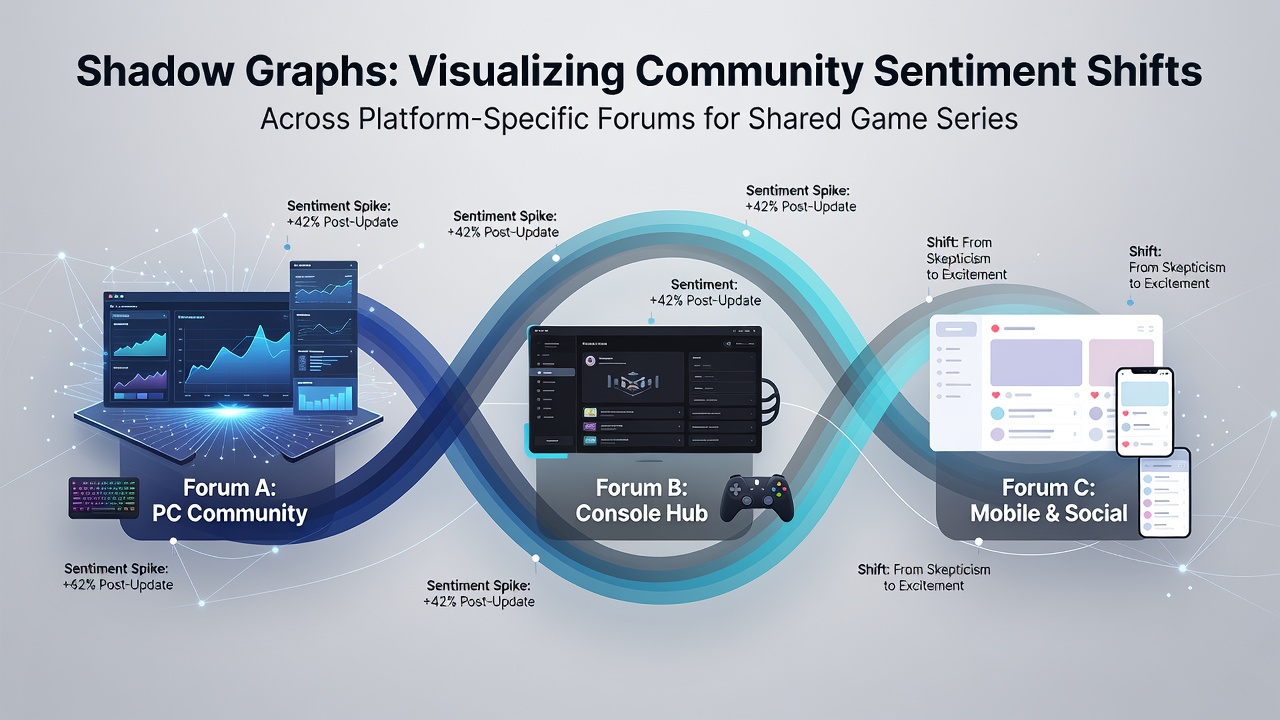
Shadow Graphs: Visualizing Community Sentiment Shifts Across Platform-Specific Forums for Shared Game Series
Shadow graphs represent a specialized visualization technique that maps changes in community sentiment by pulling data from distinct online forums tied to individual gaming platforms, and researchers apply this method to track how opinions evolve around game series that appear on PC, console, and mobile simultaneously. Developers and analysts collect posts, comments, and threaded discussions from platform-specific sites, then convert those textual elements into layered graphs that highlight positive, negative, or neutral shifts over defined time periods.
Data Collection Methods from Platform Forums
Analysts gather raw information through API integrations and web scraping tools that target dedicated subforums for each platform version of a shared title, and this approach allows separation of console player reactions from those on mobile or PC communities. Studies indicate that aggregation occurs at regular intervals, often weekly or monthly, to capture incremental changes rather than isolated spikes. Figures from industry reports reveal that major series such as ongoing multiplayer franchises generate thousands of relevant posts each week across these segmented spaces, creating datasets large enough for statistical modeling.
Construction of Shadow Graph Layers
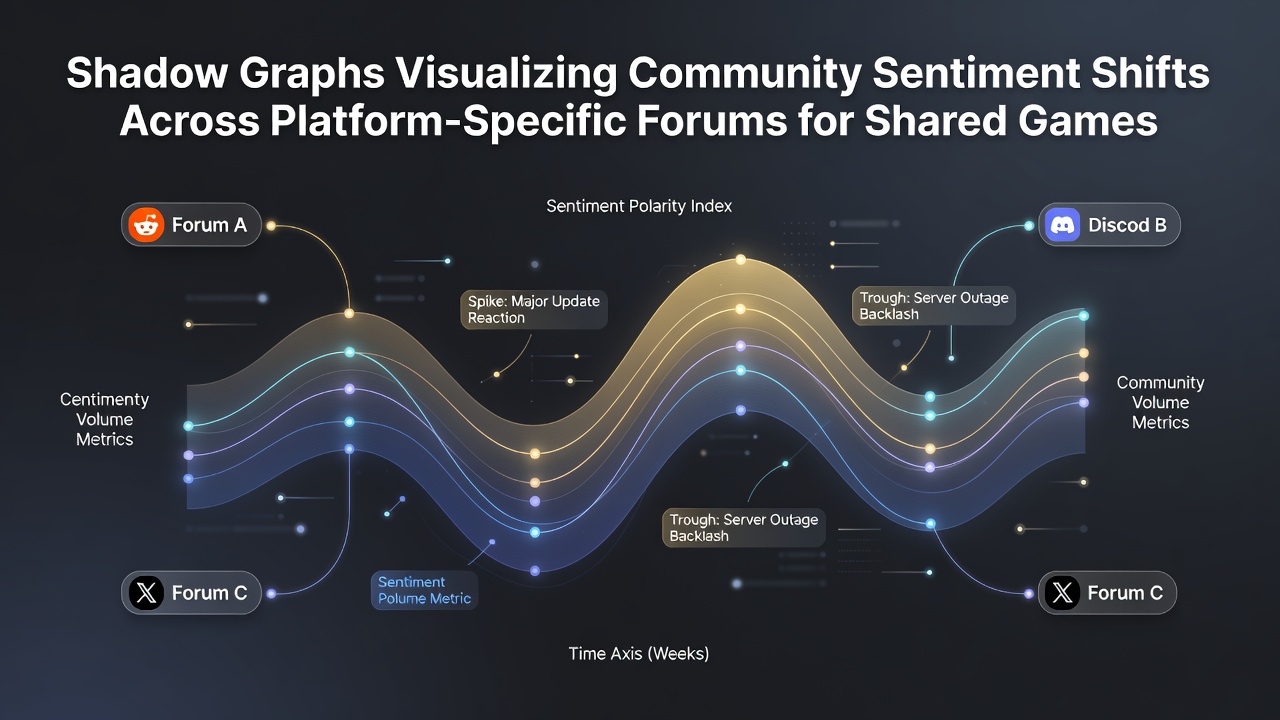
Each layer in a shadow graph corresponds to one platform's forum activity, with color gradients and opacity levels used to represent sentiment intensity while overlapping lines illustrate cross-platform correlations. Software tools process natural language inputs through sentiment analysis algorithms trained on gaming terminology, and these algorithms assign numerical scores that translate directly into visual elements. Observers note that the resulting graphs reveal patterns such as delayed sentiment propagation, where mobile forum discussions lag behind console reactions by several days during major updates.
Case Examples from Shared Game Series in 2026
During July 2026, analysts applied shadow graphs to a long-running action role-playing series available across all three major platforms, and the visualizations showed a pronounced dip in mobile forum sentiment coinciding with a console patch release that altered progression systems. Data points collected from PC discussion boards indicated earlier positive responses that gradually influenced console communities, yet mobile threads remained isolated until specific balance adjustments arrived later that month. Researchers at academic institutions have documented similar divergences in previous years, confirming that platform-specific mechanics often drive these segmented reactions.
Another application involved a racing game franchise with simultaneous releases, where shadow graphs highlighted rapid sentiment recovery on console forums after a server adjustment while PC communities sustained elevated negativity tied to input device compatibility issues. These layered outputs help identify which platform forums serve as early indicators for broader community trends across the entire series.
Integration with Broader Analytics Tools
Shadow graphs frequently combine with existing metrics such as review aggregation scores and social media volume counts, and this combination produces composite dashboards used by development teams to prioritize feature adjustments. Industry organizations like the Entertainment Software Association have referenced similar visualization approaches in annual reports that track community engagement patterns. Academic research conducted at institutions including the University of Melbourne has explored algorithmic refinements that improve accuracy when handling slang common in gaming discussions.
Challenges in Implementation and Accuracy
Platform forums often enforce different moderation policies that affect the visibility of certain sentiments, and analysts must account for these variations during data preprocessing to avoid skewed graph outputs. Language nuances across regions add another layer of complexity, since translated posts require separate validation steps before inclusion in unified models. Those who maintain these systems report that real-time processing demands substantial computational resources, especially when monitoring multiple concurrent game series with overlapping release schedules.
Applications in Development Planning
Development studios incorporate shadow graph outputs into internal review cycles, allowing teams to correlate specific update deployments with measurable sentiment movements on each platform. This practice supports targeted interventions, such as releasing platform-exclusive content to address isolated negative trends before they spread. Evidence from multiple case studies shows that early detection of sentiment divergence reduces the time required to stabilize community responses following major content drops.
Conclusion
Shadow graphs provide a structured method for examining how community sentiment evolves differently across platform-specific forums connected to the same game series, and ongoing refinements in data processing continue to expand their utility for both researchers and industry practitioners. As game releases maintain simultaneous multi-platform presence, these visualizations supply concrete mapping of opinion dynamics that inform adjustment strategies and resource allocation decisions.